 Per-pupil spending in the United States declined for a third consecutive year in 2012-13, according to new data released by the National Center for Education Statistics (NCES). Although the drop slowed down to less than 1 percent from the previous year (a marked improvement from the 3 percent dip in 2011-2012), the data clearly shows that most school districts' recovery from the extreme budget cuts triggered by the recession remains slow and painful.
According to NCES, national expenditures on public education totaled $605.3 billion, which translates to $10,763 in per-pupil spending - down 0.6 percent compared with 2012, adjusting for inflation. Overall, the United States spends more per-student on public education compared to a decade ago. Spending increased at least 1 percent per year between 2003–04 and 2007–08, peaking at $11,621 in 2008-09. But it's been downhill ever since.
The NCES data shows the wide disparities in per-pupil funding across the 50 states (see map below). Those that spend on average more than $15,000 per student are concentrated in the northeast, whereas states that spend less than $10,000 per student are found mostly throughout the South and some Western states. Utah scores the lowest in the nation, spending only $6,432 per student.
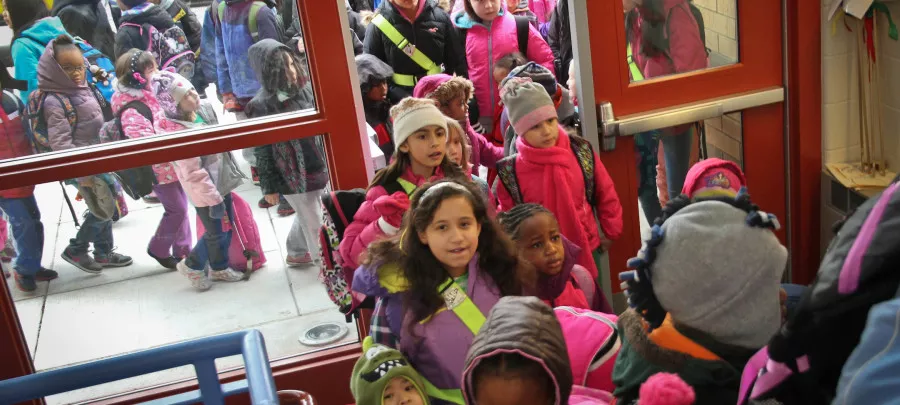
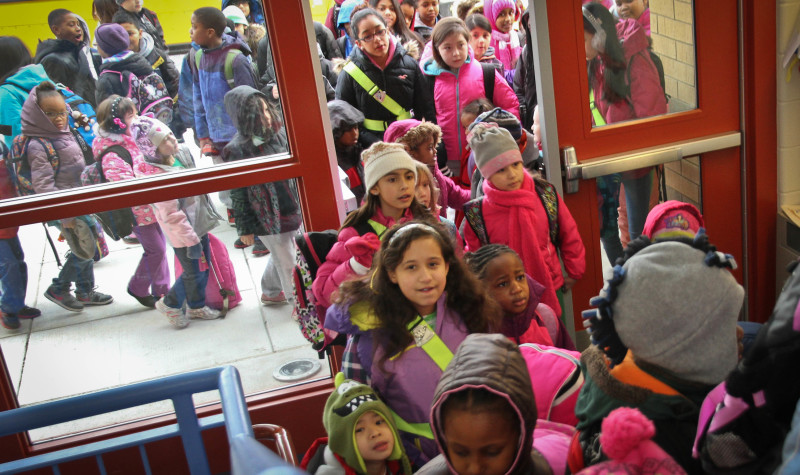
State and local governments provided roughly $550 billion, or almost 91 percent of all revenues, with the federal government contributing $55 billion or 9 percent percent. Because local and state funding is so heavily reliant on property taxes, zip code largely determines the quality of education. For students in low-income districts, that means significantly less resources and supports than students in more affluent communities. Federal funding got a major boost from the American Recovery and Reinvestment Act, passed in early 2009, which increased the federal share to 13 percent in 2010-11. But these funds began to dry up the following school year, putting more pressure on state and local governments to provide enough funding for a fair and equitable education - which very few did.
As a recent analysis by the Center on Budget and Policy Priorities (CPBB) revealed, more than 30 states provided less state funding per student in the 2014 school year than in the 2008 school year. In 15 states, those cuts exceeded 10 percent.
At the federal level, funding for programs benefitting disadvantaged students are struggling to recover from the brutal cuts imposed by the harmful sequestration bills passed in 2011. In a separate report, CPBB found that funding for low-income programs in fiscal year 2016 is now 10 percent below FY2010 levels. As President Obama prepares to release his budget proposal for FY2017, NEA will be pushing hard for improved investment in education programs that serve students in need, notably Title I, IDEA, and HEAD Start.