Published: April 26, 2022
Key Findings
-
For 2020-21, K-12 ESPs working full time (at least 30 hours per week) earned an average of $32,837. During the same school year, higher education ESP working full time earned an average of $44,225.
-
13.7% of K-12 ESPs working full time earned less than $15,000, and 27.8% earned between $15,000 and $24,999. Within higher education, 17.4 percent earn less than $25,000, and 7.5 percent earn less than $15,000.
-
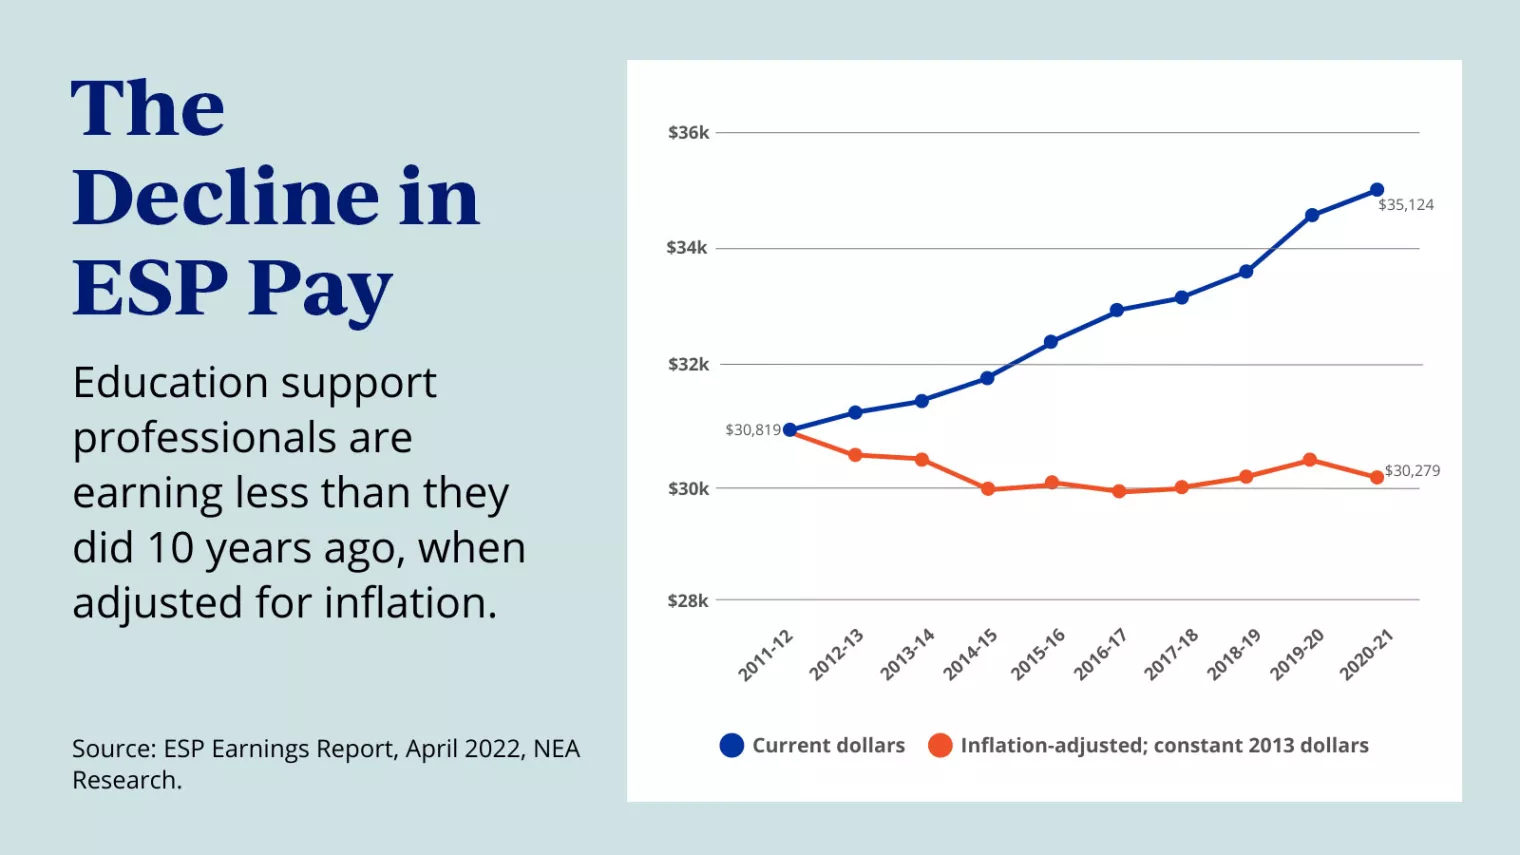
The average salary for ESP has risen from $30,819 in 2011-12 to $35,124 in 2020-21. When adjusted for inflation, the earnings for ESP in 2012 dollars has fallen from $30,819 to $30,279.
View more educator pay data
Earning Averages for Full-Time Workers
| | Total | Rank | K-12 | Rank | Higher Ed | Rank |
|---|---|---|---|---|---|---|
| United States | $35,124 | $32,837 | $44,225 | |||
| Alabama | $31,766 | 37 | $28,418 | 40 | $42,166 | 28 |
| Alaska | $44,142 | 1 | $43,845 | 2 | $46,239 | 14 |
| Arizona | $31,349 | 38 | $28,492 | 39 | $43,369 | 25 |
| Arkansas | $29,870 | 42 | $27,802 | 42 | $37,276 | 46 |
| California | $41,413 | 5 | $39,005 | 7 | $51,216 | 3 |
| Colorado | $34,713 | 23 | $31,674 | 26 | $44,718 | 21 |
| Connecticut | $41,248 | 6 | $39,492 | 6 | $51,715 | 2 |
| Delaware | $44,044 | 2 | $44,738 | 1 | $40,209 | 37 |
| District of Columbia | $41,889 | 4 | $40,794 | 3 | $50,197 | 4 |
| Florida | $32,704 | 31 | $30,775 | 28 | $40,564 | 36 |
| Georgia | $31,315 | 39 | $29,296 | 36 | $39,683 | 39 |
| Hawaii | $40,248 | 10 | $38,515 | 9 | $46,862 | 13 |
| Idaho | $29,085 | 45 | $25,830 | 51 | $37,248 | 47 |
| Illinois | $36,773 | 15 | $34,289 | 14 | $44,843 | 20 |
| Indiana | $32,232 | 33 | $29,355 | 35 | $41,266 | 34 |
| Iowa | $34,530 | 25 | $29,538 | 31 | $47,292 | 10 |
| Kansas | $29,470 | 44 | $26,737 | 46 | $39,400 | 41 |
| Kentucky | $28,783 | 48 | $26,891 | 44 | $37,775 | 43 |
| Louisiana | $29,804 | 43 | $27,096 | 43 | $41,619 | 33 |
| Maine | $33,274 | 27 | $31,805 | 24 | $40,726 | 35 |
| Maryland | $40,523 | 8 | $38,851 | 8 | $46,209 | 15 |
| Massachusetts | $39,495 | 11 | $37,364 | 11 | $49,510 | 5 |
| Michigan | $34,558 | 24 | $30,133 | 29 | $47,481 | 9 |
| Minnesota | $35,928 | 18 | $32,859 | 18 | $47,596 | 8 |
| Mississippi | $28,477 | 49 | $26,258 | 49 | $35,238 | 51 |
| Missouri | $32,033 | 35 | $29,489 | 33 | $42,462 | 27 |
| Montana | $31,968 | 36 | $30,038 | 30 | $37,338 | 45 |
| Nebraska | $32,614 | 32 | $29,429 | 34 | $41,814 | 30 |
| Nevada | $37,936 | 12 | $36,525 | 12 | $46,132 | 17 |
| New Hampshire | $32,073 | 34 | $29,506 | 32 | $47,997 | 7 |
| New Jersey | $42,037 | 3 | $40,250 | 4 | $53,202 | 1 |
| New Mexico | $29,076 | 46 | $26,876 | 45 | $36,558 | 49 |
| New York | $40,954 | 7 | $39,586 | 5 | $48,845 | 6 |
| North Carolina | $32,847 | 30 | $29,228 | 37 | $43,002 | 26 |
| North Dakota | $35,717 | 20 | $31,715 | 25 | $46,115 | 18 |
| Ohio | $36,047 | 17 | $33,474 | 17 | $45,881 | 19 |
| Oklahoma | $28,246 | 51 | $26,121 | 50 | $35,570 | 50 |
| Oregon | $35,057 | 22 | $32,158 | 23 | $44,454 | 22 |
| Pennsylvania | $35,764 | 19 | $34,020 | 15 | $43,923 | 24 |
| Rhode Island | $40,275 | 9 | $37,653 | 10 | $47,039 | 12 |
| South Carolina | $30,933 | 41 | $28,409 | 41 | $41,781 | 32 |
| South Dakota | $28,465 | 50 | $26,644 | 47 | $36,919 | 48 |
| Tennessee | $28,866 | 47 | $26,524 | 48 | $38,419 | 42 |
| Texas | $31,189 | 40 | $29,067 | 38 | $41,785 | 31 |
| Utah | $36,170 | 16 | $32,781 | 19 | $42,034 | 29 |
| Vermont | $32,984 | 29 | $32,198 | 22 | $39,650 | 40 |
| Virginia | $35,238 | 21 | $32,755 | 20 | $44,354 | 23 |
| Washington | $37,723 | 13 | $35,468 | 13 | $47,197 | 11 |
| West Virginia | $33,044 | 28 | $31,285 | 27 | $39,977 | 38 |
| Wisconsin | $37,192 | 14 | $33,638 | 16 | $46,209 | 16 |
| Wyoming | $33,686 | 26 | $32,431 | 21 | $37,766 | 44 |
Earnings Distribution
| | Total ESP | Under $15,000 | $15- 24,999 | $25- 34,999 | $35- 44,999 | $45,000+ | ||
|---|---|---|---|---|---|---|---|---|
| United States | 100% | 12.4% | 24.1% | 22.0% | 15.4% | 26.1% | ||
| Alabama | 100% | 13.3% | 31.8% | 20.8% | 13.5% | 20.6% | ||
| Alaska | 100% | 11.8% | 7.0% | 23.4% | 14.8% | 43.1% | ||
| Arizona | 100% | 16.6% | 26.6% | 25.0% | 14.1% | 17.7% | ||
| Arkansas | 100% | 17.1% | 32.0% | 21.4% | 13.2% | 16.3% | ||
| California | 100% | 7.8% | 15.1% | 20.2% | 17.0% | 39.9% | ||
| Colorado | 100% | 11.7% | 23.8% | 20.9% | 16.5% | 27.1% | ||
| Connecticut | 100% | 5.9% | 16.3% | 20.4% | 14.5% | 42.9% | ||
| Delaware | 100% | 5.0% | 8.8% | 14.2% | 29.5% | 42.5% | ||
| District of Columbia | 100% | 9.6% | 12.0% | 22.6% | 13.2% | 42.6% | ||
| Florida | 100% | 11.5% | 29.5% | 23.4% | 15.7% | 20.0% | ||
| Georgia | 100% | 15.8% | 30.3% | 22.8% | 12.6% | 18.5% | ||
| Hawaii | 100% | 7.9% | 12.4% | 23.5% | 21.1% | 35.1% | ||
| Idaho | 100% | 23.1% | 27.1% | 24.0% | 12.3% | 13.5% | ||
| Illinois | 100% | 11.0% | 23.7% | 21.4% | 16.1% | 27.8% | ||
| Indiana | 100% | 16.2% | 26.7% | 23.0% | 13.8% | 20.3% | ||
| Iowa | 100% | 17.9% | 25.3% | 19.9% | 13.8% | 23.1% | ||
| Kansas | 100% | 25.6% | 27.6% | 20.4% | 11.3% | 15.0% | ||
| Kentucky | 100% | 21.9% | 30.9% | 22.8% | 10.7% | 13.6% | ||
| Louisiana | 100% | 18.2% | 33.9% | 17.5% | 10.8% | 19.6% | ||
| Maine | 100% | 7.4% | 24.5% | 30.3% | 24.1% | 13.7% | ||
| Maryland | 100% | 10.0% | 12.8% | 25.8% | 17.9% | 33.4% | ||
| Massachusetts | 100% | 8.4% | 19.7% | 21.2% | 14.7% | 36.0% | ||
| Michigan | 100% | 15.8% | 24.1% | 23.3% | 14.2% | 22.6% | ||
| Minnesota | 100% | 11.8% | 25.0% | 20.1% | 15.8% | 27.3% | ||
| Mississippi | 100% | 16.4% | 34.4% | 23.8% | 10.2% | 15.2% | ||
| Missouri | 100% | 14.1% | 28.2% | 24.1% | 12.9% | 20.7% | ||
| Montana | 100% | 13.4% | 23.8% | 28.5% | 15.3% | 19.1% | ||
| Nebraska | 100% | 17.1% | 25.2% | 18.1% | 17.4% | 22.1% | ||
| Nevada | 100% | 6.7% | 18.6% | 23.0% | 21.3% | 30.4% | ||
| New Hampshire | 100% | 13.6% | 28.9% | 32.9% | 8.3% | 16.3% | ||
| New Jersey | 100% | 6.9% | 16.2% | 19.7% | 16.4% | 40.8% | ||
| New Mexico | 100% | 20.4% | 32.8% | 19.5% | 10.3% | 17.1% | ||
| New York | 100% | 7.9% | 14.7% | 21.6% | 19.6% | 36.2% | ||
| North Carolina | 100% | 10.3% | 27.1% | 27.4% | 16.9% | 18.3% | ||
| North Dakota | 100% | 9.2% | 24.1% | 25.6% | 17.2% | 23.9% | ||
| Ohio | 100% | 9.9% | 25.3% | 20.0% | 16.9% | 27.9% | ||
| Oklahoma | 100% | 21.5% | 31.3% | 19.8% | 12.2% | 15.2% | ||
| Oregon | 100% | 9.2% | 21.6% | 26.0% | 17.5% | 25.7% | ||
| Pennsylvania | 100% | 11.2% | 21.8% | 19.9% | 21.2% | 26.0% | ||
| Rhode Island | 100% | 7.1% | 13.5% | 19.9% | 21.8% | 37.6% | ||
| South Carolina | 100% | 15.8% | 28.0% | 23.7% | 15.7% | 16.9% | ||
| South Dakota | 100% | 25.1% | 24.2% | 24.8% | 10.5% | 15.4% | ||
| Tennessee | 100% | 21.8% | 30.5% | 21.3% | 12.9% | 13.5% | ||
| Texas | 100% | 15.5% | 32.4% | 21.0% | 11.7% | 19.5% | ||
| Utah | 100% | 14.6% | 18.0% | 23.3% | 15.9% | 28.3% | ||
| Vermont | 100% | 8.5% | 26.0% | 27.1% | 20.9% | 17.5% | ||
| Virginia | 100% | 10.5% | 25.2% | 21.5% | 15.1% | 27.6% | ||
| Washington | 100% | 7.7% | 21.3% | 20.7% | 18.8% | 31.5% | ||
| West Virginia | 100% | 7.7% | 23.1% | 38.4% | 13.7% | 17.0% | ||
| Wisconsin | 100% | 11.9% | 22.1% | 20.0% | 17.6% | 28.4% | ||
| Wyoming | 100% | 15.5% | 20.1% | 29.1% | 16.2% | 19.0% |
Trends
1
OF
2
Education support professionals are earning less than they did 10 years ago, when adjusted for inflation.
2
OF
2
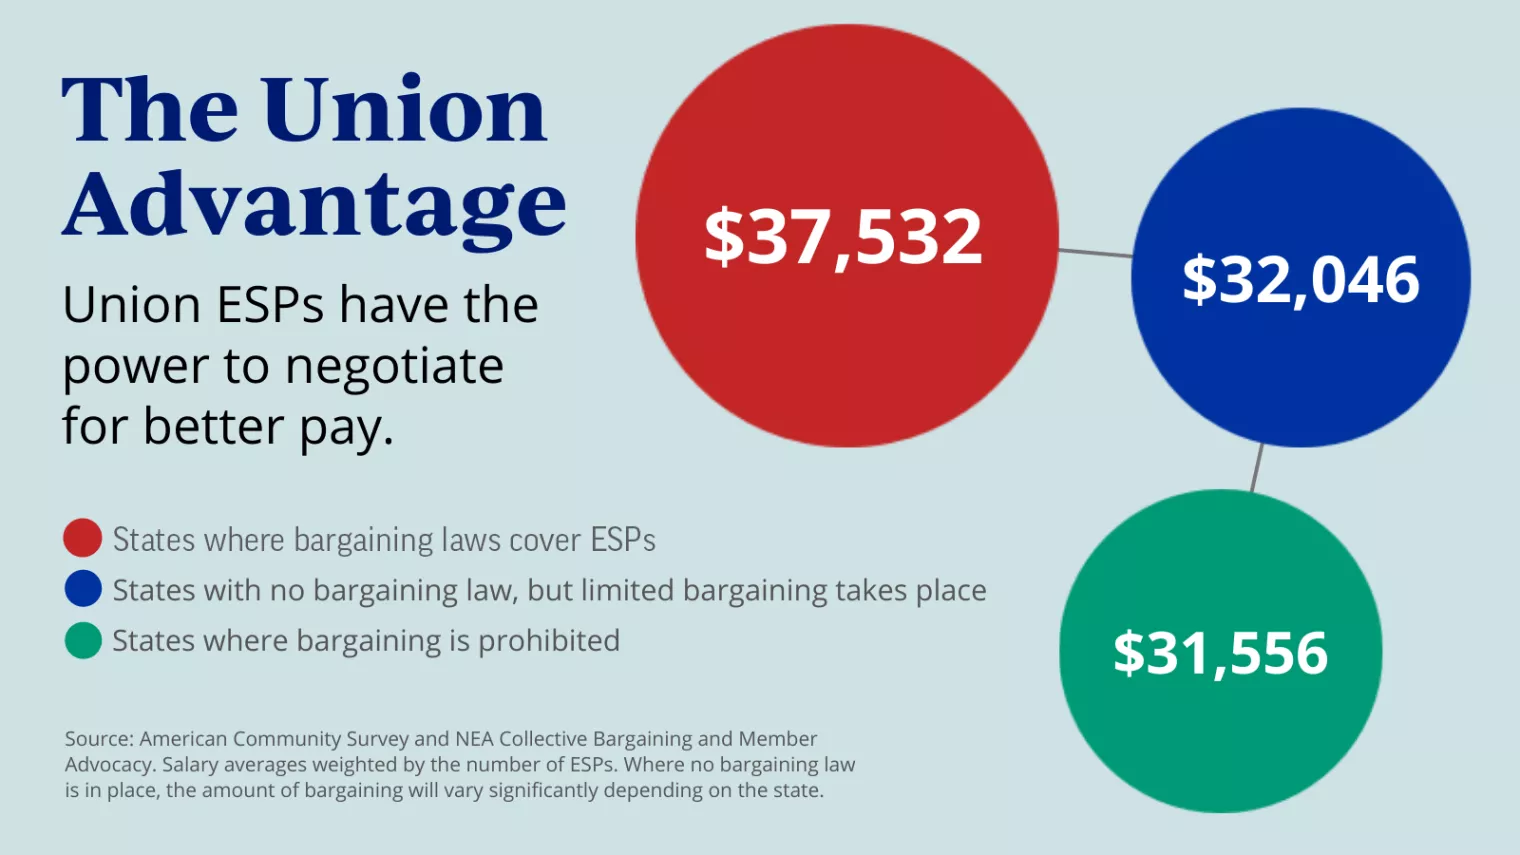
Union ESPs have the power to negotiate for better pay.
Downloads
Are you an affiliate?
Jump to updates, opportunities, and resources for NEA state and local affiliates.

Collaborating for Student Success
Successful collaboration requires commitment. The Collaborating for Student Success guidebook includes a comprehensive framework for successful collaboration, grounded in research and on-the-ground practice, as well as a number of tools to support you in your own collaboration efforts.
Stay Informed We'll come to you
We're here to help you succeed in your career, advocate for public school students, and stay up to date on the latest education news. Sign up to stay informed