Published: April 26, 2022
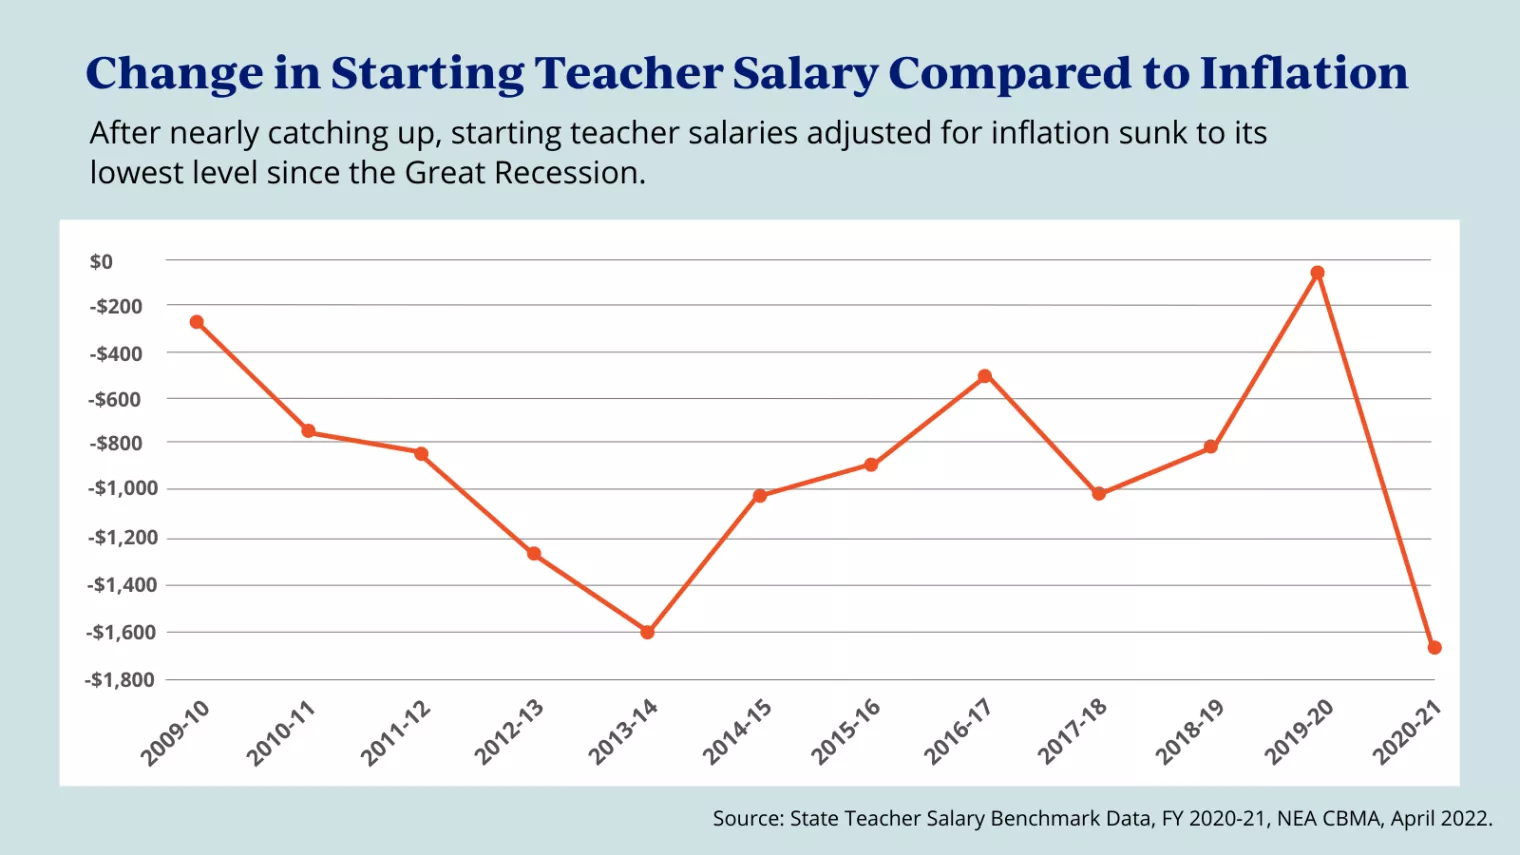
The average starting teacher salary for 2020-2021 was $41,770, an increase of 1.4% over 2019-2020. When adjusted for inflation, this represents a 4% decrease from 2019-2020, undoing all the gains made over the previous two years.
Fueled by Red for Ed, starting salaries had nearly caught up to inflation after persistently lagging in the decade following the Great Recession. However, uncertainty brought on by the pandemic and high inflation following the reopening of the economy has sunk real salaries to their lowest levels since NEA began tracking teacher salary benchmarks more than a decade ago.
More educator pay data
Teacher Salary Benchmark Averages
| State | Starting Salary | Top Bachelor's | Starting Master's | Top Master's | Top Salary |
|---|---|---|---|---|---|
| US | $41,770 | $60,381 | $45,391 | $70,279 | $76,540 |
| Alabama | $41,163 | $52,862 | $47,242 | $60,457 | $69,466 |
| Alaska | $49,907 | NA | NA | NA | $88,247 |
| Arizona | $40,554 | $52,130 | $43,211 | $61,237 | $68,910 |
| Arkansas | $35,803 | $48,371 | $39,995 | NA | $54,163 |
| California | $49,933 | NA | NA | NA | $99,912 |
| Colorado | $35,724 | $45,273 | $39,313 | $56,740 | $64,646 |
| Connecticut | $47,477 | NA | $51,478 | $90,099 | $95,823 |
| Delaware | $43,448 | $61,348 | $49,416 | $77,440 | $88,135 |
| Dist. of Columbia | $56,313 | $89,294 | $60,067 | $110,179 | $116,408 |
| Federal | $54,311 | $105,224 | $62,007 | $113,321 | $130,622 |
| Florida | $44,040 | $61,484 | $46,561 | $64,025 | $66,405 |
| Georgia | $38,692 | $56,790 | $43,902 | $64,779 | $80,262 |
| Hawaii | $50,123 | $71,403 | $54,132 | $77,115 | $91,948 |
| Idaho | $39,842 | $52,420 | $41,233 | $56,797 | $59,110 |
| Illinois | $41,228 | $60,922 | $45,400 | $75,916 | $84,146 |
| Indiana | $38,158 | NA | NA | NA | $70,398 |
| Iowa | $38,515 | NA | NA | NA | $71,877 |
| Kansas | $39,100 | $44,148 | $42,159 | $54,321 | $60,878 |
| Kentucky | $37,373 | $53,261 | $41,180 | $58,153 | $62,950 |
| Louisiana | $42,185 | $54,821 | $42,951 | $56,205 | $58,470 |
| Maine | $37,580 | $62,637 | $40,308 | $66,552 | $68,748 |
| Maryland | $48,510 | $64,972 | $51,619 | $87,379 | $95,142 |
| Massachusetts | $48,372 | $77,082 | $52,310 | $85,109 | $95,147 |
| Michigan | $37,820 | $64,815 | $42,423 | $70,437 | $74,803 |
| Minnesota | $41,234 | $56,034 | $46,363 | $67,763 | $73,141 |
| Mississippi | $36,653 | $55,397 | $39,095 | $63,290 | $70,175 |
| Missouri | $33,234 | $42,322 | $36,124 | $52,109 | $56,552 |
| Montana | $32,495 | $44,333 | $36,670 | $61,144 | $65,785 |
| Nebraska | $36,491 | $44,949 | $43,251 | $61,839 | $69,490 |
| Nevada | $41,277 | $54,477 | $47,621 | $69,778 | $78,530 |
| New Hampshire | $39,737 | $59,880 | $43,489 | $67,459 | $71,905 |
| New Jersey | $54,053 | $85,220 | $57,845 | $89,966 | $93,932 |
| New Mexico | $41,737 | $56,114 | $42,703 | $66,364 | $69,690 |
| New York | $47,618 | $77,720 | $52,170 | $88,896 | $94,795 |
| North Carolina | $37,127 | $55,160 | $40,839 | $60,675 | $63,359 |
| North Dakota | $40,907 | NA | $44,808 | NA | $64,009 |
| Ohio | $38,231 | $66,430 | $42,341 | $77,508 | $82,236 |
| Oklahoma | $38,074 | $52,759 | $39,508 | $54,849 | $57,151 |
| Oregon | $39,338 | $55,851 | $43,744 | $68,988 | $74,191 |
| Pennsylvania | $46,991 | $72,842 | $50,703 | $80,046 | $85,503 |
| Rhode Island | $44,592 | $83,803 | $47,696 | $87,158 | $89,594 |
| South Carolina | $37,704 | $55,511 | $43,029 | $62,842 | $76,568 |
| South Dakota | $40,128 | $52,981 | $44,063 | $55,078 | NA |
| Tennessee | $39,024 | $52,091 | $42,327 | $56,840 | $64,967 |
| Texas | $44,527 | $62,634 | $47,569 | $64,939 | $63,673 |
| Utah | $44,349 | $66,473 | $48,354 | $76,945 | $81,594 |
| Vermont | $40,810 | $56,139 | $45,846 | $70,737 | $77,192 |
| Virginia | $42,251 | $66,844 | $44,918 | $70,473 | $72,255 |
| Washington | $51,040 | $61,318 | $60,253 | $88,713 | $98,792 |
| West Virginia | $37,987 | $59,073 | $40,813 | $61,936 | $65,778 |
| Wisconsin | $38,961 | NA | NA | NA | $73,364 |
| Wyoming | $46,826 | $55,813 | $51,280 | $67,448 | $74,513 |
Starting Teacher Salary
| State | Starting Salary | Rank | $40K Districts | District Percent | $40K Teachers | Teacher Percent | Starting Salary 2019-2020 | Salary Change |
|---|---|---|---|---|---|---|---|---|
| Alabama | $41,163 | 24 | 138 | 100% | 41,978 | 100% | $41,041 | 0.30% |
| Alaska | $49,907 | 6 | 47 | 100% | 7,396 | 100% | $48,547 | 2.80% |
| Arizona | $40,554 | 27 | 76 | 55% | 37,118 | 81% | $39,084 | 3.80% |
| Arkansas | $35,803 | 48 | 28 | 12% | 12,112 | 33% | $35,201 | 1.70% |
| California | $49,933 | 5 | 750 | 94% | 229,790 | 99% | $49,303 | 1.30% |
| Colorado | $35,724 | 49 | 31 | 18% | 33,581 | 65% | $35,266 | 1.30% |
| Connecticut | $47,477 | 10 | 169 | 100% | 40,025 | 100% | $46,905 | 1.20% |
| Delaware | $43,448 | 17 | 18 | 100% | 8,569 | 100% | $43,092 | 0.80% |
| Dist. of Columbia | $56,313 | 1 | 1 | 100% | 4,101 | 100% | $56,313 | 0.00% |
| Federal | $54,311 | 16 | 100% | 0 | $52,840 | 2.80% | ||
| Florida | $44,040 | 16 | 58 | 87% | 160,551 | 98% | $38,822 | 13.40% |
| Georgia | $38,692 | 35 | 43 | 22% | 82,057 | 71% | $38,509 | 0.50% |
| Hawaii | $50,123 | 4 | 1 | 100% | 12,221 | 100% | $48,428 | 3.50% |
| Idaho | $39,842 | 29 | 90 | 85% | 12,191 | 77% | $38,554 | 3.30% |
| Illinois | $41,228 | 23 | 446 | 51% | 101,249 | 79% | $40,487 | 1.80% |
| Indiana | $38,158 | 38 | 86 | 28% | 31,058 | 53% | $37,628 | 1.40% |
| Iowa | $38,515 | 36 | 97 | 30% | 12,482 | 35% | $37,908 | 1.60% |
| Kansas | $39,100 | 32 | 117 | 41% | 27,613 | 76% | $38,314 | 2.10% |
| Kentucky | $37,373 | 44 | 18 | 11% | 14,225 | 34% | $37,238 | 0.40% |
| Louisiana | $42,185 | 19 | 41 | 72% | 28,726 | 88% | $41,747 | 1.10% |
| Maine | $37,580 | 43 | 35 | 20% | 3,664 | 26% | $36,391 | 3.30% |
| Maryland | $48,510 | 7 | 24 | 100% | 61,439 | 100% | $47,959 | 1.10% |
| Massachusetts | $48,372 | 8 | 220 | 99% | 53,166 | 100% | $47,432 | 2.00% |
| Michigan | $37,820 | 41 | 108 | 24% | 26,230 | 41% | $37,555 | 0.70% |
| Minnesota | $41,234 | 22 | 255 | 77% | 43,305 | 88% | $40,321 | 2.30% |
| Mississippi | $36,653 | 46 | 7 | 5% | 2,759 | 9% | $36,561 | 0.30% |
| Missouri | $33,234 | 50 | 33 | 6% | 18,910 | 28% | $32,970 | 0.80% |
| Montana | $32,495 | 51 | 3 | 2% | 518 | 6% | $31,725 | 2.40% |
| Nebraska | $36,491 | 47 | 7 | 3% | 8,290 | 35% | $35,862 | 1.80% |
| Nevada | $41,277 | 21 | 11 | 65% | 18,963 | 81% | $40,732 | 1.30% |
| New Hampshire | $39,737 | 30 | 66 | 41% | 6,346 | 45% | $38,982 | 1.90% |
| New Jersey | $54,053 | 2 | 584 | 100% | 112,901 | 100% | $53,228 | 1.50% |
| New Mexico | $41,737 | 20 | 44 | 100% | 18,877 | 100% | $41,123 | 1.50% |
| New York | $47,618 | 9 | 442 | 85% | 86,171 | 86% | $47,078 | 1.10% |
| North Carolina | $37,127 | 45 | 5 | 4% | 24,450 | 26% | $37,049 | 0.20% |
| North Dakota | $40,907 | 25 | 112 | 59% | 6,737 | 73% | $40,110 | 2.00% |
| Ohio | $38,231 | 37 | 188 | 31% | 52,858 | 57% | $37,565 | 1.80% |
| Oklahoma | $38,074 | 39 | 52 | 10% | 19,643 | 48% | $37,992 | 0.20% |
| Oregon | $39,338 | 31 | 61 | 37% | 19,789 | 67% | $38,307 | 2.70% |
| Pennsylvania | $46,991 | 11 | 445 | 91% | 97,243 | 96% | $46,232 | 1.60% |
| Rhode Island | $44,592 | 13 | 30 | 100% | 8,647 | 100% | $43,577 | 2.30% |
| South Carolina | $37,704 | 42 | 5 | 6% | 4,827 | 9% | $37,615 | 0.20% |
| South Dakota | $40,128 | 28 | 63 | 49% | 5,427 | 59% | $39,636 | 1.20% |
| Tennessee | $39,024 | 33 | 45 | 32% | 37,590 | 58% | $38,753 | 0.70% |
| Texas | $44,527 | 14 | 452 | 71% | 308,207 | 95% | $43,922 | 1.40% |
| Utah | $44,349 | 15 | 40 | 98% | 26,127 | 100% | $43,026 | 3.10% |
| Vermont | $40,810 | 26 | 79 | 59% | 5,254 | 72% | $40,307 | 1.20% |
| Virginia | $42,251 | 18 | 98 | 74% | 79,304 | 91% | $42,069 | 0.40% |
| Washington | $51,040 | 3 | 180 | 100% | 55,337 | 100% | $49,091 | 4.00% |
| West Virginia | $37,987 | 40 | 3 | 6% | 1,558 | 8% | $37,978 | 0.00% |
| Wisconsin | $38,961 | 34 | 218 | 52% | 29,403 | 50% | $38,678 | 0.70% |
| Wyoming | $46,826 | 12 | 47 | 98% | 7,212 | 99% | $46,558 | 0.60% |
| United States | $41,770 | 6,233 | 53% | 2,148,194 | 76% | $41,182 | 1.40% |
Trends
1
OF
3
After nearly catching up, starting teacher salaries adjusted for inflation sunk to its lowest level since the Great Recession.
2
OF
3
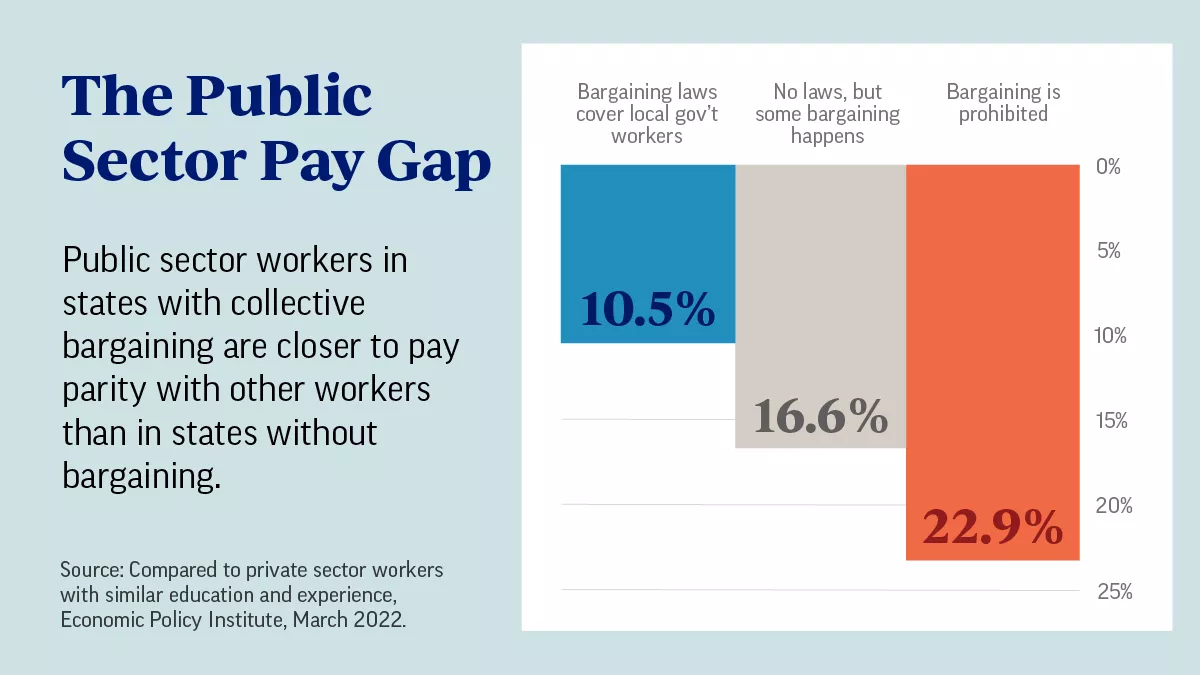
Public sector workers in states with collective bargaining are closer to pay parity with other workers than in states without bargaining.
Economic Policy Institute

3
OF
3
In the past year, starting teacher pay in states with collective bargaining increased more than in states without bargaining.
Are you an affiliate?
Jump to updates, opportunities, and resources for NEA state and local affiliates.

Bargaining for the Common Good
Together, we can improve student learning and the educational environment, like smaller class size, fewer standardized tests, more recess and art and music classes, and additional counselors.
Stay Informed We'll come to you
We're here to help you succeed in your career, advocate for public school students, and stay up to date on the latest education news. Sign up to stay informed